The QNT Editor
![]() Peak Table, Amount Table, Peak Tracking, and MS Tracking
Peak Table, Amount Table, Peak Tracking, and MS Tracking
The peak table contains all parameters required to identify a peak and to determine the amounts of the substances serving as standards. The peak table contains a minimum of 26 columns (the Amount, C0, C1, and C2 columns are duplicated as required, depending on the number of different standards). By default, the peak table consists of four tabs: Peak Table, Amount Table, Peak Tracking, and MS Tracking. You can show and hide columns and entire pages.
Usually, the peak table is created manually; i.e., the user enters the names and retention times of the expected peaks. In addition, (s)he labels peaks serving as standard peaks correspondingly in the Standard column. The (known) concentration of a standard is indicated as the Amount in the Amount column. These values form the basis for any type of calibration.
Select Autogenerate Peak table on the Edit menu to automate peak table creation. There are two ways how to create a peak table:
Select Enumerate peaks of current chromatogram to include all peaks integrated in the current sample in the peak table. The peak name is the sequence name plus a consecutive number.
Select Use Spectra Library Screening results to use reference spectra found via ![]() Spectra Library Screening for automatic peak table creation.
Spectra Library Screening for automatic peak table creation.
In both cases, Chromeleon recalculates the values in the Retention Time and Window columns and replaces all other entries with the default settings (see Integrating Chromatograms and Identifying Peaks ![]() Autogenerating the Peak Table).
Autogenerating the Peak Table).
![]() Caution:
Caution:
All previous entries are overwritten. Thus, they are lost when you save the peak table or the QNT File.
For more information, refer to Integrating Chromatograms and Identifying Peaks ![]() Creating a Peak Table
Creating a Peak Table
Peak Identification/Peak Tracking and MS Tracking
Peak identification refers to the following procedure: A previously unknown peak is identified due to peak-specific properties, such as the retention time or UV spectrum, and labeled with a characteristic substance name.
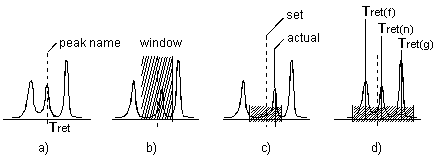
Peaks are usually identified by their retention times. If you know the exact retention time of a peak, enter the retention time and the Substance name in the corresponding columns of the peak table. If a peak is detected at the specified time, the name is automatically assigned (Fig. a).
To ensure peak identification even if there are retention time fluctuations or neighboring peaks, use the Window peak table parameter to define a tolerance range (fig. b). If a peak is detected within the tolerance range, it is identified, even if the set (nominal) and the actual retention time do not match exactly (fig. c). If several peaks are detected within this range, Chromeleon identifies the "greatest," the "first," or the "nearest" peak, depending on the selected extension for the window parameter (fig. d).

The retention time value previously entered in the peak table is corrected accordingly!
Peaks can be identified by the UV spectrum, too. You can use the Spectrum or the spectrum and retention time (Spectrum and time). This method requires a Photodiode Array Detector, such as the Dionex UVD 340U. For each peak, Chromeleon records the substance spectrum and compares it to the library spectra, using certain criteria (see Integrating Chromatograms and Identifying Peaks![]() Peak Tracking). If the spectra match, the peak is identified. This method is very reliable.
Peak Tracking). If the spectra match, the peak is identified. This method is very reliable.
If you use a Mass Spectrometer, peak identification can be based on Mass Spectra. Use the MS Tracking tab page to select different options (see Integrating Chromatograms and Identifying Peaks ![]() Identifying Peaks via Their Mass Spectra (MS Tracking)). This method is also very reliable.
Identifying Peaks via Their Mass Spectra (MS Tracking)). This method is also very reliable.
Calibration/Amount Table
During calibration, the peak area of a known standard amount is determined. The result is used for calculating the amount of unknown samples via the area to amount ratio.
Enter the amount contained in the different substances. In addition, determine the calibration function and specify whether external and/or internal standards will be used.
This is performed via the Amount, Standard, Cal.Type, and Integration Type columns in the Amount Table and/or Peak Table. For a description of the columns and for details on the required column input, refer to Calibrating:
![]() Entering Amount Values (Amount Column)
Entering Amount Values (Amount Column)
![]() Selecting the Standard Method (Standard Column)
Selecting the Standard Method (Standard Column)
![]() Selecting the Calibration Function (Cal. Type and Int. Type Columns)
Selecting the Calibration Function (Cal. Type and Int. Type Columns)
![]() Tip:
Tip:
For background information about calibration, refer to Theory of Calibration ![]() Calibration (Overview). For information about how to perform calibration, refer to Integrating Chromatograms and Identifying Peaks
Calibration (Overview). For information about how to perform calibration, refer to Integrating Chromatograms and Identifying Peaks ![]() Calibrating.
Calibrating.
Calculating the Amount of Samples with Several Channels
If no retention time is defined in the QNT Editor for one of the channels, a special procedure is required for calculating the amount of samples with several channels (e.g., SIM or UV channels). For a more detailed description, refer to Calibrating Samples with Several Channels with an Internal Standard Substance in Calibrating ![]() Calibrating with an Internal Standard Substance.
Calibrating with an Internal Standard Substance.