Creating a Peak Table
![]()
![]() Identifying Peaks via Their Mass Spectra (MS Tracking)
Identifying Peaks via Their Mass Spectra (MS Tracking)
(Mass peak x, MS threshold, MS filter conditions, and Check MS ret. times columns)
Mass Spectra present a very reliable method for peak identification. For the available parameters, refer to the MS Tracking tab page.

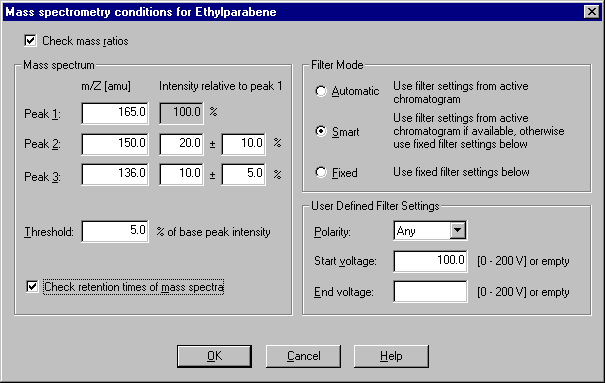
Double-click the respective cell or press the F8 key to open the Mass spectrometry conditions for dialog box:

If you have entered the mass of at least one mass peak, you can enable and disable peak identification via mass spectra by selecting the Check mass ratios check box.
Under Mass Peak 1, enter the mass of the substance (range: 1.0 to 2000.0 m/z) that is expected at this peak. If you expect fragmentation and can estimate the fragments, you can enter two of them, with their expected intensities, under Mass Peak 2 and Mass Peak 3.
Select the MS Threshold option to filter the noise. A mass is detected in the mass spectrum only if its relative intensity compared to the Base Peak (largest peak) is higher than the threshold value.
The filter settings limit the mass spectra used for peak identification. This option is required if you modify the polarity and/or use a different maximum voltage for ionization of the sample.
Select the Check retention time of mass spectra check box to use the retention times of all masses for peak assignment. All retention times must be within one scan.
The settings selected in the Mass spectrometry conditions for dialog box are not active immediately. You can activate them later from the Peak Table tab page: Press the F8 key in the Window column or double-click to open the Peak Window for dialog box. Select the Check mass ratios check box.
If you acquire data with a Photodiode Array Detector, you can identify peaks via their UV spectra. (For more information, refer to ![]() Identifying Peaks via Their UV Spectra (Peak Tracking)).
Identifying Peaks via Their UV Spectra (Peak Tracking)).