Creating a Peak Table
![]() Autogenerating the Peak Table
Autogenerating the Peak Table
To save the user from having to determine the retention time of each peak, peak tables can be created automatically by selecting Autogenerate Peak Table on the Edit or context menu.
Chromeleon automatically generates a peak table, entering the retention times of all detected peaks of the currently open chromatogram as set times. The user need only complete the table by entering component names and altering the default window and other values as necessary. Peaks, which are not of interest, can be deleted from the table. These will consequently be excluded from the report, provided that the Including all not detected peaks of the peak table parameter in the Integration Report Properties (Table Properties command on the Edit or context menus) is turned to OFF.
During automatic table generation, the variables described below are set as follows:
Autogenerated Peak Table is entered as Comment.
The peak names (Name) are constructed from the name of the QNT Method; for example, in the Test peak table, detected peaks will be assigned the names Test-1, Test-2, Test-3, etc.
The Window values are entered as absolute values; they represent one-third of the distance from the nearest peak.
No Group.
The Amount values and the Response Factor are set to 1.0.
The peak type (Sample Type) is Auto; that is, Chromeleon determines the peak type.
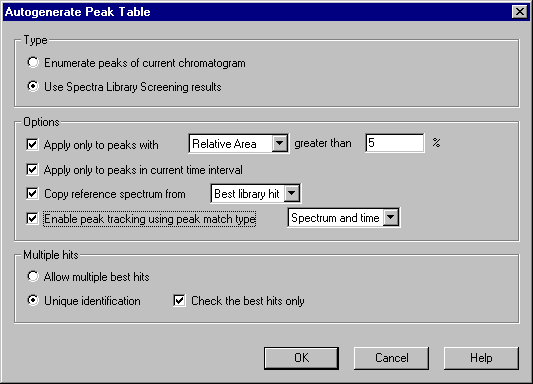
If you select Autogenerate Peak Table on the Edit menu to generate peak tables, it is possible to use the results of the spectra library screening (type: Use spectra library screening results) instead of enumerating all peaks in the chromatogram (type: Enumerate peaks of current chromatogram).

In this case, library screening is performed based on the parameters entered in the QNT File. The peak table will include all peaks for which at least one reference spectrum was found and the name of the best hit.
The following options can also be used:
Apply only to peaks with: With this option, only peaks exceeding a selectable absolute or relative area or height will be included in the peak table.
Apply only to peaks in current time interval: Click this button to include only peaks in the currently displayed section of the chromatogram; for example, in the zoomed chromatogram section.
Copy reference spectrum from: This option simultaneously includes the reference spectrum for each peak. Either the current peak spectrum from the displayed chromatogram or the library spectrum of the best hit from library screening can be used. If you want to use the library spectrum of the best hit, make sure that the Use spectra library screening results autogeneration option is enabled in the upper window section.
Select Enable peak tracking using peak match type to enable peak tracking for each included peak. Select Spectrum or Spectrum and time as match type (see How to …: Integrating Chromatograms and Identifying Peaks ![]() Peak Tracking).
Peak Tracking).
Allow multiple best hits or Unique identification: The results of the spectra library screening will produce a hit list of library spectra for each peak in the chromatogram. If Unique Identification is selected, these hit lists are handled as in Peak Tracking; that is, multiple identical hits with smaller match factors are eliminated. In the case of Allow multiple best hits, each peak in the chromatogram is copied to the peak table with the best hit. If the best hits are identical, this can result in identical entries in the peak table. In this case, adding a number to the name generates a unique peak; for example 2-, -3.
If you have generated a new peak table via Autogenerate Peak Table, a note is automatically included in the Comment column of the peak table:
If you have selected Enumerate peaks of current chromatogram, the comment is: Autogenerated.
If you have selected Use spectra library screening results, the comment is: Autogenerated. Spectrum: Name of reference spectrum, Match: Match factor.
![]() Tip:
Tip:
If Use spectra library screening results is enabled, the settings made on the Spectra Library Screening tab page are automatically entered in the peak table (Peak Tracking tab page).