Creating a Peak Table
![]() Identifying Peaks via Their UV Spectra (Peak Tracking)
Identifying Peaks via Their UV Spectra (Peak Tracking)
Chromeleon allows you to perform peak tracking. Peak tracking means identifying peaks by comparing spectra. In addition to the Reference Spectrum column, other peak table columns also allow you to influence spectra comparison: Match Criterion, Check Derivative, Min. WL, Max. WL, Threshold, Rel. Max. Deviation, and Check Extrema. The values entered in these columns have the same meaning as described in How to …: Displaying and Using UV Spectra ![]() Entering Criteria for the Spectra Library Screening.
Entering Criteria for the Spectra Library Screening.
![]() Tip:
Tip:
Unless you set the minimum wavelength (Min. WL) or maximum wavelength (Max. WL), the comparison is performed for the entire wavelength range of the reference spectrum.
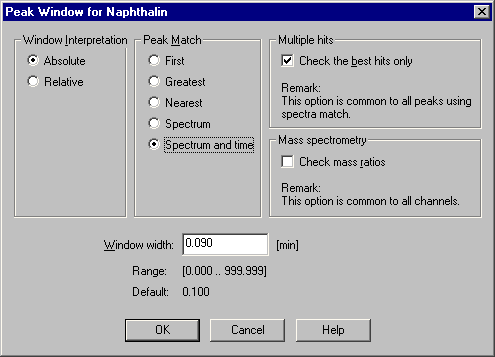
To enable peak tracking, press the F8 key in any cell in the Window column (or double-click). In the Commands dialog box, select Spectrum or Spectrum and time under Peak Match.

The algorithm for peak identification by comparing spectra can be described as follows: If, in the Window column of the peak table, the Peak Match criterion for a peak is Spectrum or Spectrum and time, peak tracking uses the reference spectra in the corresponding column. If Spectrum and time is selected, the spectra comparison is limited to the specified time window. Peak tracking generates a list of spectra sorted by the match factor; a peak hit list is not displayed.
![]() Tips:
Tips:
Peak tracking is performed using the parameters (match criteria, etc.) specified for the peak in the peak table.
The peak hit list includes only peaks with a match factor above the threshold specified for this peak.
An empty peak hit list indicates that no spectrum fulfilling the match criteria was found. This could be due to a very high threshold.
The peak hit list is calculated for all peaks in the peak table, for which peak tracking was enabled. After calculation, the peak hit lists are checked for multiple hits. If the Check the best hits only option is enabled, only the best hits are compared for the individual peaks. In case of multiple hits, the peak with the best match factor receives the name of the reference substance.
Usually, multiple hits are not found if you select Spectrum and time as match criterion.
All other peaks in the peak table, i.e., peaks for which the peak tracking function is disabled, are identified via the window assignment (First, Nearest, Greatest) as described in ![]() Identifying Peaks.
Identifying Peaks.
If you acquire data with a Mass Spectrometer, you can identify peaks via their mass spectra. (For more information, refer to ![]() Identifying Peaks via Their Mass Spectra (MS Tracking)).
Identifying Peaks via Their Mass Spectra (MS Tracking)).