Calibration Examples
![]() Calibration Mode: Total
Calibration Mode: Total
If standard samples exist, the ratio between the amount and the peak area can be used to calculate the calibration coefficients c0 (offset), c1 (slope), and c2 (curvature) by means of the selected Calibration Function. The resulting values are entered in the Formula for Amount Calculation, together with the area values of the substance of an unknown sample. As the result, Chromeleon provides the Amount of substance A in the unknown sample. You can also use the concentration instead of the amount. However, in this case, the concentration must be seen in relation to the injection volume.
Example:
You want to determine the concentration of the substances A and B in two samples (Sample 1 and Sample 2). One standard solution (Std 1) is available containing substance A in a concentration of 12 mg/l and substance B in a concentration of 17 mg/l. The calibration curve for substances A and B shall be linear and run through the origin (calibration type: linear). The curve shall show two calibration points for each substance. As only one standard solution is available, two different volumes (10 and 20 µl) must be injected (Dilution Series). Two Calibration Points are resulting. The autosampler injects a volume of 10 µl for the two unknown samples. The standard and analysis samples occupy the autosampler positions R99, RA1, and RA2.
a) User Input
Sample List

For more information, refer to Creating and Managing Files and Data ![]() Creating a Sample List (Sequence).
Creating a Sample List (Sequence).
QNT Method/Peak Table Tab

Regarding this example, note the following:
Select the External standard method in the Standard column using the F8 edit box.
Only one standard concentration (Std 1) is available for calibrating the substances A and B. That is why one concentration value for each substance is entered in the Amount column of the peak table. The same applies if several sample list entries are generated by analyzing the same standard sample several times (twice, in this case). If the injection volume is identical, the calibration is referred to as 1-point calibration with several replicates. If the injection volume varies (10 and 20 µl) as in this case, this is referred to as multiple-point calibration, that is, 2-point calibration. This is a special case of the Dilution Series ("concentration series").
However, if two separate standards with different concentrations are available (two vials, different autosampler positions), two concentration values need to be entered in the Amount column of the peak table.
All other entries in the peak table are based on the criteria described in How to …: Integrating Chromatograms and Identifying Peaks ![]() Creating a Peak Table.
Creating a Peak Table.
QNT Method/General Tab
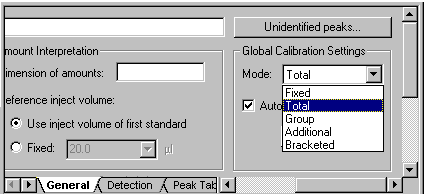
To calibrate all samples (here: samples 1 and 2) with the two standard samples, select the Total Calibration Mode.

QNT Method/Calibration Tab
This page shows all standard samples (of a sequence) that are used for calibrating the current sample.

Press the F4 key or the SHIFT+F4 key combination to open all samples of a sequence one after the other. The standard samples used for calibrating the sample are shown for each sample.
If you notice that an error occurred during the analysis of the standard sample, you can "exclude" this standard. Remove the standard in the Enable column on the Calibration tab page of the QNT Editor. Only the standard samples labeled X are considered for the calibration.
b) Analysis Structure
Injection is four times. During the first run, the first calibration point of the calibration curves of the substances A and B is determined based on the determined area values. In the second run, the second point is determined accordingly. Run three serves to determine the area values of the substances A and B of sample 1. In the fourth run, the area values of A and B of sample 2 are determined.
The following area values are resulting:
|
Name |
Area Subst. A |
Area Subst. B |
|
STD 1 (first run) |
150 |
200 |
|
STD 2 (second run) |
300 |
400 |
|
Sample I |
175 |
150 |
|
Sample II |
95 |
180 |
c) Calculation of the Calibration Coefficients
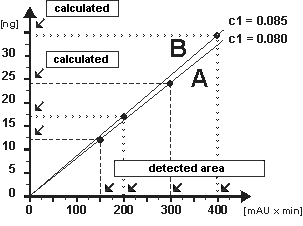
From the area values of the standard samples and the corresponding concentration values, you can determine the four value pairs. The intersection of each value pair represents a calibration point. Based on the selected calibration type (in the example: ![]() Calibration Type (Linear)), Chromeleon calculates the optimum course of the calibration curve; that is, the system tempts to find a course with four calibration points on or near the curve. If the course of the curve is established, the corresponding calibration coefficients (c0, c1, c2) can be calculated.
Calibration Type (Linear)), Chromeleon calculates the optimum course of the calibration curve; that is, the system tempts to find a course with four calibration points on or near the curve. If the course of the curve is established, the corresponding calibration coefficients (c0, c1, c2) can be calculated.
|
Substance |
y/x-value pair |
c1 |
|
A A B B |
12/150 24/300 17/200 34/400 |
0.08 0.08 0.085 0.085 |
With a linear course through the origin, the calibration curve can be described by one single coefficient (c1). C1 expresses the slope of the curve. If all calibration points are located exactly on the calibration line, the resulting c1 calibration coefficient is the direct y/x-quotient of each value pair.

If the calibration points are not located exactly on one line, Chromeleon calculates an optimized approximate c1 value for each substance from the Calibration Function.
If a different calibration type (Theory of Calibration ![]() Calibration Type (Non-Linear)) is used, Chromeleon also calculates the remaining calibration coefficients (c0 and c2).
Calibration Type (Non-Linear)) is used, Chromeleon also calculates the remaining calibration coefficients (c0 and c2).
d) Amount Calculation
If the calibration coefficients of a substance A are known, each area value from an unknown sample for substance A can be converted into an amount value by inserting the values in the calibration function. When inserting this value into the Formula for Amount Calculation, the actual amount value will result.
When you perform this action for the peak areas of the substances A and B in samples I and II (the correction factors of the formula for amount calculation are assumed with 1.0), the following amount values are calculated:
|
Sample |
Calculation |
Amount. A |
Amount B |
|
I |
175 x 0.08 |
14.00 |
|
|
I |
150 x 0.085 |
|
12.75 |
|
II |
95 x 0.08 |
7.60 |
|
|
II |
180 x 0.085 |
|
15.30 |
For an overview of the different calibration possibilities provided by Chromeleon, refer to How to …: ![]() Calibrating.
Calibrating.