Creating a Peak Table
![]() Identifying Peaks
Identifying Peaks
(Peak Name, Retention Time, and Window columns)
Most frequently, peaks are identified by their retention time.
Enter the names of all peaks to be identified in the Peak Name column, line by line. Assign a nominal retention time to each peak by entering a retention time value in the Ret. Time peak table column (= manually creating a peak table). Or else:
Select ![]() Autogenerate Peaktable on the Edit menu to generate the peak table automatically, based on the current sample. In this case, Chromeleon includes all integrated peaks of the current sample into the peak table. The assigned peak names consist of the sequence name and a consecutive number. Chromeleon uses the maximum values of the single peaks to recalculate the values to be entered in the Retention Time and Window columns. All other entries are replaced by the default values (= automatically creating a peak table).
Autogenerate Peaktable on the Edit menu to generate the peak table automatically, based on the current sample. In this case, Chromeleon includes all integrated peaks of the current sample into the peak table. The assigned peak names consist of the sequence name and a consecutive number. Chromeleon uses the maximum values of the single peaks to recalculate the values to be entered in the Retention Time and Window columns. All other entries are replaced by the default values (= automatically creating a peak table).
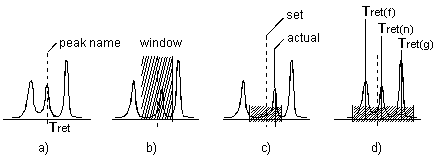
If a peak is detected at the specified time in an unknown sample, the peak is automatically assigned a name (fig. a).
Identification is possible even if the retention times deviate or if neighboring peaks are very close. To allow this, use the Window (fig. b) peak table parameter to define a tolerance range. If a peak is detected in this range, it is identified even if the nominal and the actual retention times do not coincide exactly (fig. c). If several peaks are detected in this range, Chromeleon identifies the greatest peak, the first peak, or the peak nearest to the retention time (fig. d), depending on the selected option.

To open the Peak Window dialog box, mark the Window column cell of the peak of interest, and then either press the F8 key or double-click in the cell. Determine the Window Interpretation: Select Absolute to enter the window width in minutes. Select Relative to define the window width in percent.
In the Peak Match section, select the criterion for peak identification. If you use a Photodiode Array Detector, you can also identify the peaks by the spectrum or by the spectrum and the retention time. For more information, refer to ![]() Identifying Peaks via Their UV Spectra (Peak Tracking). If you use a Mass Spectrometer for data acquisition, you can identify the peaks by their mass spectra. (For more information, refer to
Identifying Peaks via Their UV Spectra (Peak Tracking). If you use a Mass Spectrometer for data acquisition, you can identify the peaks by their mass spectra. (For more information, refer to ![]() Identifying Peaks via Their Mass Spectra (MS Tracking).)
Identifying Peaks via Their Mass Spectra (MS Tracking).)
The Window column in the peak table indicates the window width in Decimal Minutes; for example, 0.25, followed by the abbreviation for the selected window interpretation and the peak match criterion. To identify the greatest peak in a 30-second window, the entry in the column must be as follows: 0.25 AG (0.25 min or 15 seconds to the left and right of the retention time). If the entry is 0.25 AN, the peak that is nearest to the nominal retention time is identified.
![]() Notes:
Notes:
The retention times and window values indicated in the peak table are intended for peak identification only. The retention times indicated in a Report are the actual retention times (i.e., the retention time in the peak maximum).
If the retention time of the same peak shifts from sample to sample due to a column trend, it is possible for the peak to leave the retention time window at some point. In this case, peak identification is no longer possible. However, Chromeleon provides a method to reliably identify peaks even then: Select the Use Recently Detected Retention Time check box on the General tab page of the QNT Editor.
In addition to peak identification by the nominal retention time, it is possible to identify compounds by their substance spectrum.