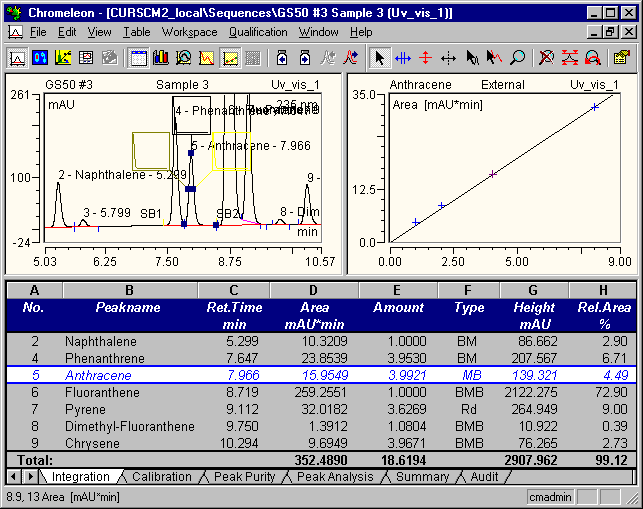
The Integration Window
Chromatographic results appear in the Integration window. In addition, you can use this window to reprocess single chromatograms. Usually, the following items are displayed by default:
The chromatogram of the current sample
Various report tables

In addition, you may display:
The calibration curve of the current peak (see the image above)
A Trend Plot of the current peak
UV spectrum (if available)
Mass Spectrum (if available)
I-t Plot (if available)
Settings in the Integration window are saved together with the ![]() Printer Layout in the Report Definition File (RDF).
Printer Layout in the Report Definition File (RDF).
For more information, refer to: