Integration
![]() The I-t Plot
The I-t Plot
Overview
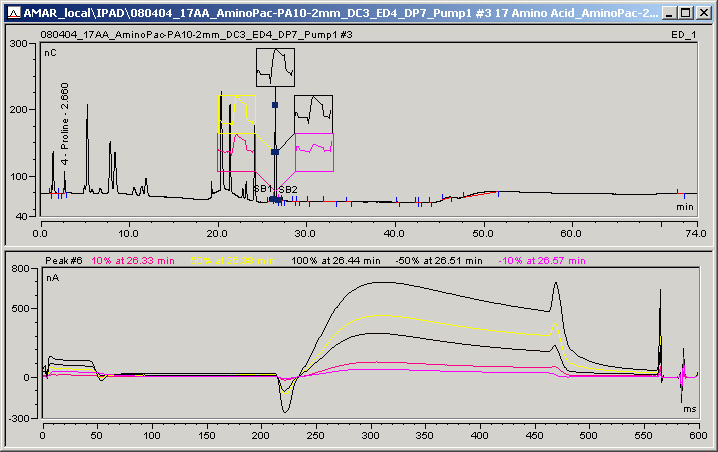
An I-t plot is a graphical display of current (I) vs. waveform time (t) of 3D_Amp data. When 3D amperometry data is collected for a sample, the I-t plot can be opened from the Integration window (see ![]() Displaying and Using I-t Plots).
Displaying and Using I-t Plots).
![]() Tip:
Tip:
3D amperometry data collection is available only with the ED electrochemical detector running in integrated amperometry mode. The Chromeleon PC must also have the 3D Data Acquisition license. To turn on collection of 3D amperometry data, enable the 3D_Amp channel on the ED Options tab page of the Program Wizard or PGM Editor.
Plot Types
Two types of I-t plots can be displayed:
Peak I-t plots are I-t plots at the peak apex or at a defined peak height. Peak I-t plots at the peak apex are also called retention time I-t plots.
Time I-t plots are I-t plots selected at any retention time in the chromatogram. They are not defined by a peak height.
Plot Normalization
The I-t plot can be (height) Normalized. When normalized, the height of the I-t plot is represented in percent. Thus, it is independent of the concentration.
Normalization allows objectively comparing two I-t plots of different concentrations. I-t plots of the same peak but different peak heights will generally coincide when overlaid, despite the differences in concentration.
To select the type of normalization applied to the I-t plot, select Decorations on the View or context menu and select the Frame & Axes tab. Normalization is off by default.
The following example shows a chromatogram in the Integration window with an I-t plot window below. The I-t plot window shows five overlaid peak I-t plots (identified by the five thumbnail images on the chromatogram).
Other features available for I-t plots in the Integration window include:
Overlaying a reference I-t plot.
Comparing I-t plots from different samples.
Displaying a difference plot or 1st or 2nd derivative plots.
For more information, refer to:
![]() Displaying Peak I-t Plots
Displaying Peak I-t Plots
![]() Displaying and Overlaying Time I-t Plots
Displaying and Overlaying Time I-t Plots
![]() Displaying Difference, 1st Derivative, or 2nd Derivative I-t Plots
Displaying Difference, 1st Derivative, or 2nd Derivative I-t Plots
I-t plots can also be displayed in the following locations:
Printer layout (see Preparing the Printout ![]() Inserting a Plot)
Inserting a Plot)
QNT Editor (see ![]() The QNT Editor)
The QNT Editor)
3D Amperometry Window (see ![]() The 3D Amperometry Window)
The 3D Amperometry Window)