Integration
![]() The Trend Plot
The Trend Plot
The Trend Plot provides a graphical representation of specific data acquired from a set of samples. You can view a trend plot from samples in an existing Sequence or perform a Query to include samples from multiple sequences. Rather than examining specific quantitative values of these samples in a report, the trend plot lets you more quickly view progressive changes, compare runs, or identify items of interest.
For example, if you view graphically the background signal in a conductivity detector for a series of runs and the trend shows a progressive increase over time, it might suggest a problem with an instrument. Or, if the same internal standard for the same column is used for a series of experiments, you can view a graphic trend of the theoretical plate calculations. A general decrease in the plate values might suggest column degradation.
When viewed in the Integration window (see ![]() Displaying and Using Trend Plots), two types of trend data variables can be plotted:
Displaying and Using Trend Plots), two types of trend data variables can be plotted:
Instrument-specific variables, such as pump pressure and background signal
Result variables, such as retention time, area, and peak height
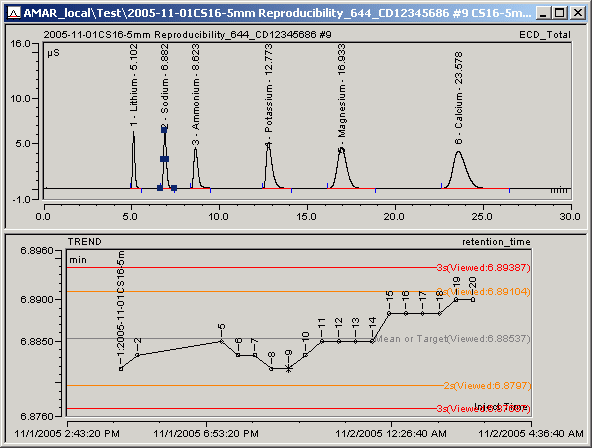
In addition to displaying the trend variable, Chromeleon can also calculate and display statistical parameters (mean, target, 1s standard deviation, 2s standard deviation, 3s standard deviation) on the plot. When a trend is shown with the target and standard deviations, you can view the data within a broader context. Statistical parameters can be calculated relative to ALL the samples selected, to only the samples in a particular view, or to user-entered target values.
A trend plot can also be included in the printer layout (see Preparing the Printout ![]() Inserting a Plot) and on a control panel (see Control Panel
Inserting a Plot) and on a control panel (see Control Panel ![]() The Trend Plot).
The Trend Plot).
The following example shows a chromatogram in the Integration window with a trend plot of sodium retention times below.
