Integration
![]() Peak Ratio
Peak Ratio
If the baseline-corrected signals of two channels (of the same sample!) are related to each other, a rectangular curve results. This curve is referred to as peak ratio. It is based on the observation that the ratio between two detector signals must be constant, as according to the Lambert-Beer law the detector signal (S) is always be proportional (c1) to the concentration (K) of a dissolved substance.
![]()
If the quotient q is formed of the two channels, the substance concentration K is reduced. The quotient now only depends on the ratio of the two wavelengths, and not of the time.
![]()
If q is entered against the time, the (theoretical) result for each peak of the sample is a horizontal line of the height c1(l1)/c1(l2).
The baseline and the Peak Purity Threshold parameter determine the width of the rectangle. The ratio is only formed where both (!) peaks have a baseline and where the intensity of both (!) peaks is above the defined peak purity threshold. Thus, the range to be actually overlaid (= width of the rectangle) is the intersection of the baseline and Peak Purity Threshold condition. The default Peak Purity Threshold value is 10% of the peak maximum. You can change this value in the QNT Editor.
The rectangle heights of two adjacent peaks differ if the corresponding peaks have different spectra and if the two wavelengths are selected so that the absorption quotient is significantly different.
Consider the following limitations and requirements:
The detector may not drift.
The correlation only applies to the linear range of the Lambert-Beer law (<2000 mAU).
The solvent composition may not be altered (isocratic conditions).
The solvent only slightly contributes to the absorption. Baseline correction allows you to eliminate the solvent absorption.
![]() Note:
Note:
A peak ratio can only be formed with the signals of the same detector.
Forming the Peak Ratio
In the Integration window, overlay two channels of the same sample, for example, by simultaneously clicking the Next/previous channel icon while pressing the CTRL key.
Select Decoration on the context menu to open the Chromatogram Decoration dialog.
Under Peak Decoration, select the Peak Ratio check box.
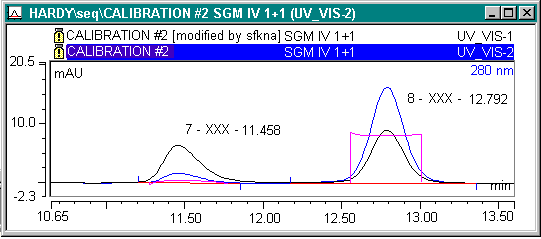
In addition to the two chromatograms, a rectangle curve should appear in a different color should appear in any place in the Integration window where two peaks are overlaid.

Result
A regular rectangle shape, as shown at 12.70min in the illustration, can serve as a criterion for evaluating the peak purity. The more the curve deviates from the rectangle shape, the higher is the probability that the overlaid peaks do not originate from the same substance. If the rectangle slightly overshoots on the right or on the left, this is tolerable due to the lower signal intensity at the peak start and the peak end.
Select the Peak Ratio Mean Value and RSD Peak Ratio report variables from the Peak Purity and Identification category to numerically express the result of the peak ratio.