Simulating Chromatograms
![]() Selecting the Analysis Parameters
Selecting the Analysis Parameters
The left side of the Virtual Column window provides controls for selecting the analysis parameters.
![]() Tip:
Tip:
To clear selections and return the Virtual Column window to the initial blank state, click Reset All.
1. Select an Analyte Category.
|
To begin a Virtual Column simulation, first select the Analyte Category. The table on the Select Analytes tab lists all analytes in the selected category for which embedded data are available. The example shows the list when Anions is the selected category. |
|
2. Select the analytes.
|
Select the check box for each analyte to be included in the Virtual Chromatogram.
If you want Virtual Column to calculate retention data for the void dip, or if you want to change its Peak Area, Asymmetry, or Efficiency values, select the Void Dip check box. If the check box is not selected, the void dip is displayed on the Virtual Chromatogram, but retention and resolution data are not calculated for it. |
|
3. (Optional) Select methodologies.
|
After you select two or more analytes, the methodologies and columns available for the selection are displayed. If more than one methodology is shown, you can restrict the column choices by clearing the check boxes from methodologies you do not want to consider. |
|
4. (Optional) Select a column diameter.
|
To restrict the column choices to a particular diameter category, clear the check boxes for all options (Standard Bore, Micro Bore, and Capillary) except the one you want to consider. |
|
5. Select a column.
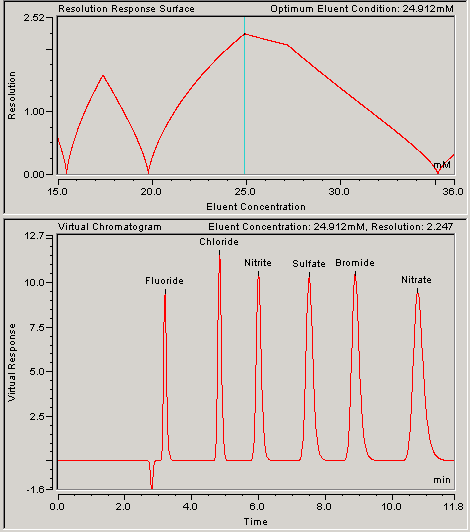
The following example shows the plot and chromatogram for Fluoride, Chloride, Nitrite, Sulfate, Bromide, and Nitrate when the AS18 column is selected using isocratic conditions.

6. (Optional) Change the Set Response By option.
The default response factor is Peak Area. You can change this to Concentration (mg/l) or Concentration (mM).
7. (Optional) Change the Inj. Volume.
After you select the Concentration option for Set Response By, a default injection volume is displayed. You can enter a different value in the edit box.
8. (Optional) Change the Peak Area, Concentration, Asymmetry, and Efficiency Values.
After you select the analytes and choose a column, the Select Analytes table displays the default Peak Area or Concentration, Asymmetry, and Efficiency values for each selected analyte. The values displayed were obtained from the experimental data embedded in Virtual Column. If you have data specific for your system, you can enter those values in the table. Virtual Column uses the new values in retention and resolution calculations.
After entering the values, you can save them to a file for later use (see ![]() Saving and Reloading Virtual Column Settings).
Saving and Reloading Virtual Column Settings).
9. (Optional) Change the Temperature.
For some columns, you can select a different temperature to view the effect of a temperature change on the Virtual Chromatogram.
10. (Optional) Change the Gradient Start.
After you select a column for a gradient simulation, a default value for the eluent concentration at the beginning of the gradient is displayed. You can select a different value from the drop-down list.
![]() Note:
Note:
See ![]() Modeling Gradient Separations for more information about gradient analyses.
Modeling Gradient Separations for more information about gradient analyses.
11. (Optional) Change the Flow Rate, Void Volume, and Void Time.
After you select the analytes and choose a column, Virtual Column displays a default flow rate, void volume (also called Dead Volume), and void time (also called Dead Time) for the selected column. You can change the flow rate and/or void volume values to more accurately model your specific system. Changing either value affects the void time (void time = void volume/flow rate).
![]() Note:
Note:
If you change the flow rate in Virtual Column, the peak shapes on the virtual chromatogram are not affected. However, under actual operating conditions, peak shapes are affected by changes in the flow rate.
12. (Optional) View the retention data.
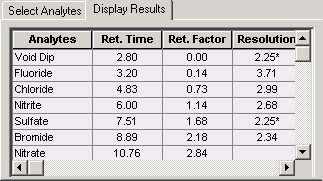
To view the calculated retention data, click the Display Results tab. See ![]() Viewing the Results Table for details.
Viewing the Results Table for details.
