Location:
Report Variable (Peak Results)
Default:
EP/USP Formula
Related Variables:
Description:
The Asymmetry peak result variable is a measure of peak fronting or tailing. The peak asymmetry helps to evaluate column quality, as long as the analysis conditions (solvent, column type, etc.) are identical.
Theoretically, peaks correspond to a symmetrical Gauss distribution. Any insufficient separation deviates from this ideal. That is why you should analyze and eliminate any distinct asymmetry. The definition varies, depending on which standard (USP, EP, or AIA) Chromeleon uses to compute asymmetry.

Parameters:
EP/USP standard
![]()
AIA standard
![]()
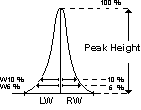
With: RW5% LW5%, RW10/%, LW10%
Right and left peak width in 5% and 10% of the peak height.
For ideal peaks, the asymmetry (A) = 1. However, for tailing peaks, A is between 1.2 and 5 (USP/EP standard). Values higher than 5 usually produce imprecise quantitative results.
If the asymmetry is calculated at 10% of the peak height, this value is referred to as Skewness.
Formula using Statistical Moments

With:
|
|
= Retention time of the current peak |
|
|
= First statistical moment |
|
|
= Second statistical moment |
Contrary to the values calculated according to the USP/EP or AIA standard, asymmetry determined via Statistical Moments scatters around zero. For tailing peaks, asymmetry is positive. For fronting peaks, it is negative.
![]() Note:
Note:
EP = European Pharmacopeia
USP = United States Pharmacopeia