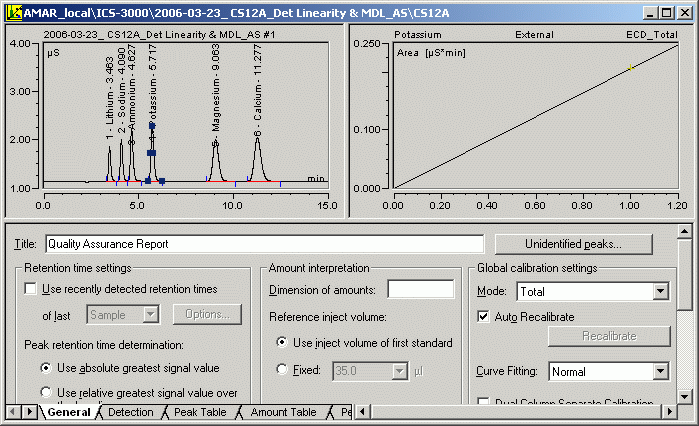
The QNT Editor
The QNT Editor allows you to create a method for evaluating chromatographic results of different samples. The QNT Editor usually provides:
The chromatogram of the current sample
The calibration curve of the current peak
Various tab pages

Instead of the calibration curve, you can display the following items:
A Trend Plot of the current peak
UV spectrum (if available)
Mass Spectrum (if available)
I-t Plot (if available)
In addition, you can include report tables in the tab pages.
The QNT Editor consists of two panes. The upper pane is the information pane. The lower pane is used to create a QNT File.
Upper Pane
The upper pane displays additional information (plots):
Select Show Chromatogram or Show Calibration Curve on the View menu to display or hide the chromatogram and/or calibration curve.
Press F4 or SHIFT+F4 to toggle between the chromatograms of the individual samples. As an alternative, select Next Chromatogram or Previous Chromatogram on the File menu.
Select Show Spectra to display or hide the spectrum of a single peak.
Select Show I-t Plots on the View menu to display or hide I-t plots.
Lower Pane
On the lower pane, specify the evaluation parameters:
Click a specific tab to open a worksheet, similar to Microsoft Excel.
The worksheets are assigned default names. To rename a worksheet, double-click a name and enter a new name in the edit dialog box.
For more information, refer to ![]() Function of the QNT Editor.
Function of the QNT Editor.
The QNT Editor provides the following tabs:
General (see ![]() The General Tab Page)
The General Tab Page)
Detection (see ![]() Detection Parameters)
Detection Parameters)
![]() Peak Table, Amount Table, Peak Tracking, and MS Tracking
Peak Table, Amount Table, Peak Tracking, and MS Tracking
Calibration (see ![]() Calibration Settings)
Calibration Settings)
SST (see ![]() System Suitability Test)
System Suitability Test)
Except for the UV tab, all tabs are displayed by default. To show the UV tab, choose Select Sheets on the View menu. In the Select Sheets dialog box, select the UV check box and click OK. To hide a tab, clear the tabís check box in the Select Sheets dialog box.
To rename a tab page, double-click the tab and enter a new name.
![]() Tip:
Tip:
These topics describe the structure and functions of the individual worksheets. For detailed information about how to enter data, refer to ![]() Integrating Chromatograms and Identifying Peaks.
Integrating Chromatograms and Identifying Peaks.