Using Mass Spectrometers
![]() Showing Mass Spectra
Showing Mass Spectra
The Mass Spectra view can be added to almost all Chromeleon plots (Integration, QNT Editor (see Data Representation and Reprocessing ![]() The QNT Editor), Printer Layout) if Xcalibur is installed. To enable the mass spectra view, click the following icon:
The QNT Editor), Printer Layout) if Xcalibur is installed. To enable the mass spectra view, click the following icon:
![]()
Or else, select Show Mass Spectra on the View menu:

To add a mass spectrum to the Printer Layout, enable Layout Mode on the Edit menu. Select Insert on the View or context menu, and then select Mass Spectra Plot.
The appearance of the displayed mass spectra may be quite different, depending on which the MS instrument method was used. For more information, refer to How to …: Using Mass Spectrometers ![]() Creating a PGM File for the aQa MS or
Creating a PGM File for the aQa MS or ![]() Creating a PGM File for the MSQ. For information about which the parameters should be used in this method to receive a certain mass spectrum, refer to the Xcalibur help.
Creating a PGM File for the MSQ. For information about which the parameters should be used in this method to receive a certain mass spectrum, refer to the Xcalibur help.
![]() Note:
Note:
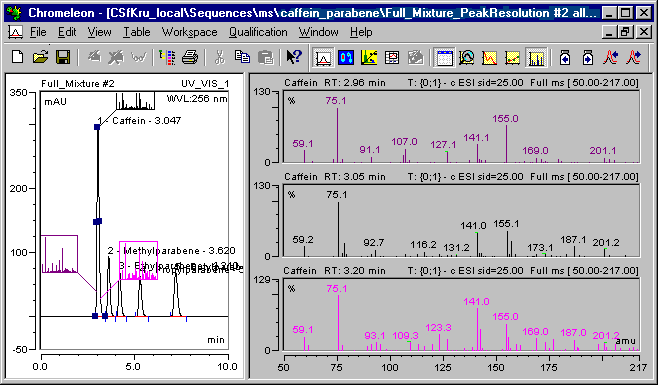
MS spectra are displayed one below the other to enhance the clearness of representation. For a large enough representation, enlarge the upper section of the entire window, if necessary.
In the captions of the single mass spectra plots, the peak name (if the mass spectrum of a peak is given) plus the retention time of the mass spectrum appear on the left. The acquisition mode appears on the right: Full ms indicates Full-Scan mode; SIM ms indicates SIM mode.
In the caption of full-scan mass spectra, the entire mass range appears in parentheses on the right. The fragmentation voltage that appears in front of the mode is important, as well.
With mass spectra that were acquired in SIM mode, no entire mass spectra are available. These SIM mass spectra are extracted from single mass traces, so the resulting SIM mass spectrum usually shows gaps between the single traces. In the caption, the single mass ranges appear together with the corresponding fragmentation voltage behind the respective mass range (following a @ sign) on the right.
How to set the MS specific parameters of the view
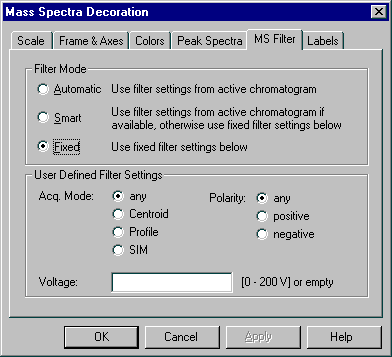
Place the pointer on the mass spectrum and right-click to open the context menu. Select Decoration, go to the MS Filter tab page, and then make the desired settings:
