Theory of Calibration
![]() Calibration Principle
Calibration Principle
Calibration means that one or several samples of known composition are chromatographically analyzed and that an amount (or concentration) / area conversion factor is calculated from the areas detected below the single peaks and the known amounts or concentrations. This conversion factor can then be used to multiply the area of the respective peak of an unknown sample. The result is the corresponding amount (or concentration) of the substance. However, this simple method will work only,
If the relation between amount and area is strictly linear, i.e., if the Lambert Beer Law is applicable for UV detectors.
If the area zero equals the amount zero, i.e., if the calibration line leads through the origin (no offset) and
If matrix effects can be neglected.
If the detector signal (S) is proportional to the concentration (K) of a dissolved substance, the proportionality factor c1 applies:
S = c1 * K
Under certain conditions, the area F(x) corresponding to a certain amount (x) is proportional to the contained amount.
F(x) = c1 * x
If a sample of the substance A of known concentration (the standard or calibration sample) is analyzed chromatographically, the result is a specific ratio between the injected amount and the determined area value. The result can be graphically presented by entering the value pair in an amount/area diagram. In this diagram, each injection corresponds to one Calibration Point.
Ideally, all calibration points are located on a straight line and a direct ratio between the amount and the determined area exists. The conversion factor corresponds to the slope of the calibration line (left fig. "ideal").
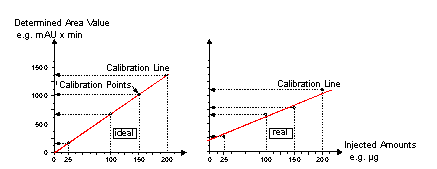
During each calibration, deviations from the ideal behavior might occur. These deviations, which are mainly caused by weight and/or dilution errors, cause scattering of calibration points. Therefore, the Gaussian method of the least squares (see ![]() Calculating the Calibration Curve) is used to calculate a regression line. This line is defined as the best approximation to the existing calibration points. Usually, it does not lead through the origin (right fig. "real").
Calculating the Calibration Curve) is used to calculate a regression line. This line is defined as the best approximation to the existing calibration points. Usually, it does not lead through the origin (right fig. "real").
If the various calibration points are not located on a straight line, but show a parabola or exponential shape, the slope of the curve and the distance to the zero point (offset) describe the corresponding (approximate) curve (calibration curve). The basic mathematical function is referred to as Calibration Function; the coefficients are the calibration coefficients.
By selecting the Calibration Type peak table variable, the user determines whether a linear or non-linear calibration curve is calculated from the existing calibration points. Distinguish between the following calibration types:
![]() Calibration Types (Linear)
Calibration Types (Linear)
![]() Calibration Types (Non-linear)
Calibration Types (Non-linear)