PPA: Peak Purity Analysis
![]() Caution:
Caution:
The basic requirement for using the PPA method is the availability of a Dionex Photodiode Array Detector. In this case, the data supplied by a detector can be "read" and viewed on any client PC. The most common method to relate chromatograms to spectra is the representation of data in a 3D Field in the method PPA. The 3D field is the default view in the iso-pixel plot representation.
Use one of the following methods to display a sample (for which you have the corresponding 3D raw data) in the method PPA:
Select the sample in the Browser, and then select Open > 3DFIELD on the context menu.
--Or--
Change from a different method to the PPA method. Click the PPA icon or select PPA on the View menu.
View and Operation
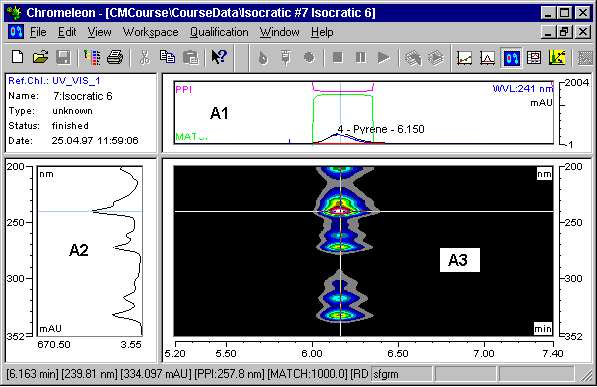
In the default view, the method window is divided in four sections. The 3D field window (A3) is the most important section. Select either Iso Pixel Plot or 3D plot (see 3D Field Presentation Modes).
The cross-wires that are freely positioned via the left mouse button or the arrow keys "extract" a chromatogram at a specific wavelength in horizontal orientation from the plot representation. In vertical orientation, a spectrum is extracted at the time t and is displayed above (A1) or next (A2) to the 3D field (A3). Select the Zoom function for a more detailed view.

To show or hide the window sections A1 and A2, select Show Chromatogram or Show Spectra. As an option, a numeric report (PPA report) can be displayed in addition (Show Report). The line of the currently selected peak is marked by a different color.
In addition to the context menu commands that allow undoing a Zoom operation, restoring the original 3D field, selecting a different 3D representation, or displaying additional information such as the PPI Index, Match Factor, etc., there are additional operations that can be executed via the keyboard or a mouse-click.
Double-click to open the 3D field Decorations dialog box.
Right-click while the 3D field is redrawn to stop redrawing. This option is useful, e.g., when you chose the wrong zoom area.
Double-click the time axis of the window to perform the Full Size command. In the wavelength scaling, the same operation performs the Autoscale command.
Press the CTRL key to make the currently displayed spectrum in the spectra window "permanent." In this way, it remains on the screen even when you move the cross-wires. The spectrum extracted via the cross-wires is displayed in addition. Perform this operation several times if you want to display several spectra in the spectra window.
It is also possible to combine pressing the CTRL key and moving the cross-wires: Position the x-axis of the cross-wires on the required wavelength and press the CTRL key. Then move the y-axis over a peak in the chromatogram. The spectra window now shows all spectra within the covered range. You can perform this procedure for various peaks in a chromatogram. Release the CTRL key between the individual peaks to represent each peak in a different color. For each peak, a number of spectra can be displayed.
If the y-axis of the cross-wires is located on a peak, the peak spectrum (= spectrum in the peak maximum) can be copied to the Windows clipboard via the Copy command. From there, the spectrum can be included in the spectra library. For this operation, approximately positioning the y-axis is sufficient.
Select one of the Extract: commands to extract the active chromatogram, the optimum integration path, the current spectrum or the 3D field data and save the item under a separate name. For a description of the required steps, refer to:
![]() Note:
Note:
Copying or printing a 3D plot is more time-consuming than copying or printing the Iso plot!
Select Library Search on the context menu to search the spectra library for the displayed spectrum. For more information, refer to Displaying and Using UV Spectra ![]() Searching Single Reference Spectra.
Searching Single Reference Spectra.
Function
Use the PPA method:
To analyze the peak purity (see Displaying and Using UV Spectra ![]() Analyzing the Peak Purity).
Analyzing the Peak Purity).
To assign peaks interactively via the spectrum.
To extract chromatograms, spectra, and the optimum integration path.
To visualize chromatograms for presentation and archiving purposes.
To evaluate baseline effects.
To check the Lambert-Beer linearity range.
To perform quantitative analysis of overlapping peaks.
To complete these methods, Chromeleon supports various procedures and calculations for result interpretation and/or comparison. These include: