Baseline Correction of Spectra
Automatic correction of a spectrum by a calculated baseline spectrum allows you to compare single spectra, even under varied conditions. Especially peak spectra on a gradient or of Rider Peaks can be compared more precisely after a large "underground portion" (due to the gradient portion or the larger main peak) is now removed.
When the spectra plot (Show Spectra) is displayed, it is always corrected by the baseline spectrum. If you enable Baseline correction in the PPA (Peak Purity Analysis) view, the baseline spectrum is also subtracted for this view.
Establishing a Baseline Spectrum
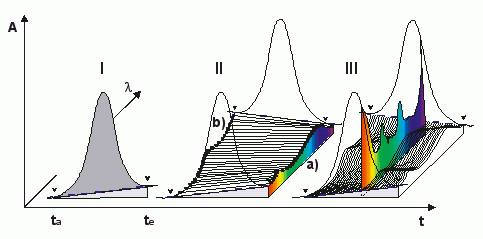
Based on the peak recognition algorithm, Chromeleon establishes the start and end of all peaks for the Reference Channel and marks these points by positioning peak delimiters (ta and te). The Baseline (I) is drawn between the two delimiters.

This is performed for all detected wavelengths. The absorbance values at all wavelengths measured at the time ta and te result in the baseline spectrum of the peak start and peak end (II, a and b). Chromeleon interpolates the two spectra and calculates a separate baseline spectrum for each data point of a peak. By definition, the 3D field is zero outside the peak delimiters if baseline correction is enabled.
Each spectrum measured at a given time t can now be corrected by a calculated baseline spectrum (III).
Baseline Correction with Manual Re-Integration
Manually shifting the peak delimiters necessarily influences the baseline spectrum. After each manipulation, the new baseline spectra are automatically re-interpolated and re-calculated.
Depending on the changes to the peak delimiters, this will also change the spectrum, for example, the spectra plot.
Useful Tips
Baseline correction can be performed only for the spectra of those peaks that are part of the integrated reference channel.
Baseline correction near the detection limits often considerably smoothes the PPI and Match Curve because it eliminates the spectral baseline portion.
The PPA report is always baseline corrected.
If you add a spectrum from the spectra plot or the PPA method to the spectra library (using Alt+S or the Extract context menu), the spectrum will be baseline-corrected only if the Baseline correction option is enabled both in the QNT editor and the PPA settings. In the QNT editor, baseline correction is enabled by default. Therefore, you usually only have to specify the PPA settings. To view settings in the QNT editor or specify PPA settings do the following:
QNT editor: Display the UV tab page in the QNT editor. The UV tab page is hidden by default. To display, see ![]() UV Spectra (UV). Baseline correction is enabled, if the Enable Background Subtraction check box is selected (default setting).
UV Spectra (UV). Baseline correction is enabled, if the Enable Background Subtraction check box is selected (default setting).
PPA settings: Open the PPA view. On the View menu select Decoration. In the Peak Purity Decoration dialog box click the General tab and select the Baseline correction check box.