PPI (Peak Purity Index)
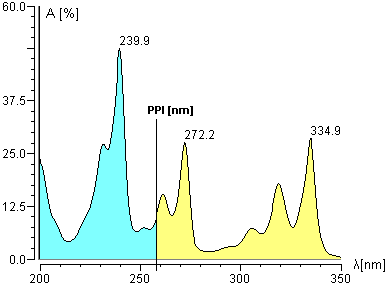
The peak purity index (PPI) represents the central wavelength of a spectrum. In simplified terms, this is the wavelength where the areas of the spectrum to the left and right are identical. The PPI is thus independent of the concentration.
A pure single peak should supply the same PPI value from peak start to peak end for each spectrum recorded in this range. The following conditions must be fulfilled:
The baseline portion must be insignificant. If this is not the case, a Blank Run Subtraction must be performed.
During analysis, the solvent composition and thus the UV absorption of the solvent may not change significantly (special attention is required for gradient applications).
Compared to the signal height, the drift must be very small.
The Lambert-Beer Law must be valid for the entire range.
In the ideal case of a pure peak, entering individual PPI values results in a rectangle curve. The height of each single rectangle corresponds to the value of the central wavelength. The deviation from the rectangle shape can be expressed mathematically by the relative standard deviation of the PPI value.
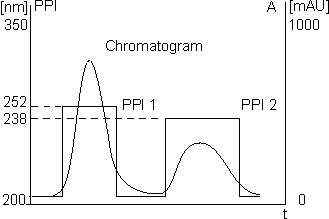
Significant deviations from the rectangle shape indicate peak impurity. However, it is not necessarily correct to deduce from the rectangular shape that the peak is pure.
![]() Tip:
Tip:
The calculation of the PPI value becomes
inaccurate near peak limits due to the poorer Signal-to-Noise
Ratio. Using the Peak
Purity Threshold detection parameter, the selection of spectra can
be limited to a sensible peak height in the QNT Editor. (For information
about the editor, see Data Representation
and Reprocessing ![]() The QNT Editor).
The QNT Editor).
If the Peak Purity Index (PPI) is entered in a report column, this value is averaged from all determined PPI values of a peak.
The deviation of single PPI values from each other can be expressed as the Relative Standard Deviation (RSD PPI) in the PPA Report.