Confidence Interval/Confidence Range
General Definition
The confidence interval describes the range in which the true value is found, with a given probability. According to the respective probability, you can define the corresponding confidence interval of the concentration or amount value for each measured value.
Calibration Curve
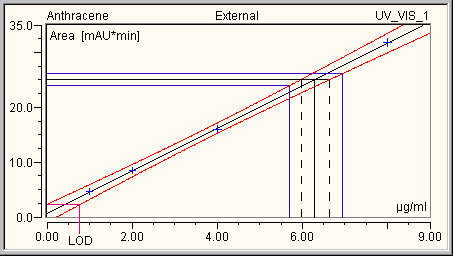
If the single points of the confidence intervals are connected in a calibration curve, they indicate the confidence range of the curve:

In the above example, the confidence interval appears at a probability of 99%: In addition, a measured value of 25 mAU*min is indicated. The concentration determined by the measured value and the calibration curve is 6.3 µg/ml (black, uninterrupted line). The two intersections with the limiting curves of the confidence interval indicate that the true concentration value will be between 6.0 and 6.6 µg/ml (probability = 99%). In addition, if the measuring uncertainty of the measured value is ±1 mAU*min, that is, between 24 and 26 mAU*min, the concentration will be between 5.7 and 6.9 µg/ml (probability = 99%; see the blue auxiliary lines).
Moreover, you can derive the Limit of Detection (= LOD) from the diagram. The LOD is the concentration of the lower limiting curve of the confidence interval, which corresponds to the intercept of the y-axis of the upper limiting curve. In the above example, the LOD would be at 0.75 µg/ml at a probability of 99%.
Confidence Interval in the Calibration Curve
It is also possible to indicate the confidence interval graphically in the calibration curve. For more information, refer to Displaying Calibration Curves ![]() Indicating the Confidence Interval.
Indicating the Confidence Interval.
Confidence Interval in the Report
In addition, you can indicate the limits of single confidence intervals in the Report using the Upper and/or Lower Confidence Limit variables of the Peak Calibration report category. You can choose between different parameters, which allow you defining the values for which to indicate the confidence intervals.
For more information, refer to How to …: Creating and Using Report Tables ![]() Setting Parameters for Variables (e.g., for the confidence interval).
Setting Parameters for Variables (e.g., for the confidence interval).