Creating and Using Report Tables
![]() Setting Parameters for Variables (e.g., for the confidence interval)
Setting Parameters for Variables (e.g., for the confidence interval)
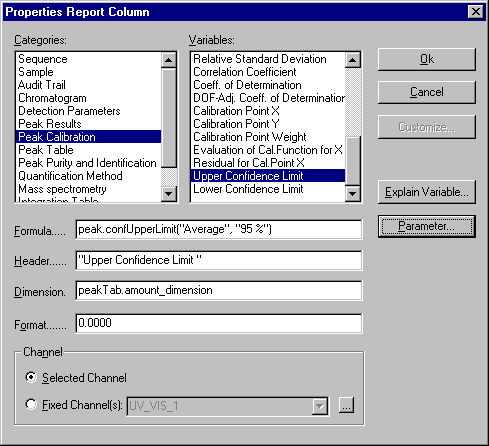
You can set special parameters for many of the report variables. For an example, refer to the description below for the limits of the Confidence Interval.
The Parameter button is enabled for those variables for which special parameters can be set.

Click Parameter to open the Parameter Input … dialog box. Use this dialog box to make the settings for the displayed report variable:

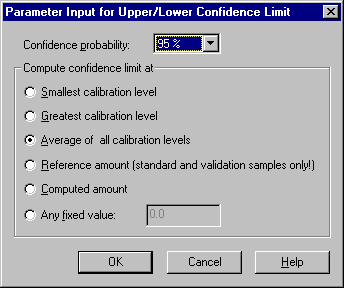
The Parameter Input for Upper Confidence Limit dialog box allows you, for example, to define the probability and the calibration level at which the upper limit of the confidence interval is computed:
|
Confidence probability |
Select the probability with which the indicated values shall apply via the arrow key. The following probability values are available: 90%, 95%, 98%, 99%, 99.7%, 99.8%, 99.9%, and 99.99%. |
|
Compute confidence limit at |
Define the level for which to compute the respective limit of the confidence interval. Select one of the following options:
|
The graphical representation of the confidence interval in the calibration curve is possible as well. For more information, refer to Displaying Calibration Curves ![]() Indicating the Confidence Interval.
Indicating the Confidence Interval.
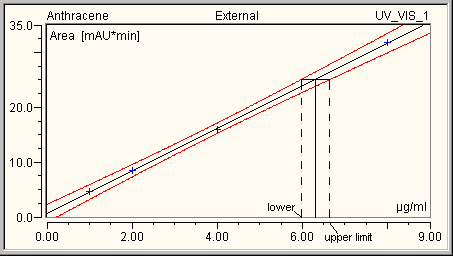
The limits of the confidence interval, which are defined using the corresponding Report variables, are determined as follows: For a given amount, the system determines the intersections with the limiting curves of the confidence interval In the height of the value that is defined via the calibration curve.

The image shows the calibration curve together with the corresponding confidence interval at a probability of 99%. In the above example, the upper and lower limits belonging to a concentration of 6.3 µg/ml are derived. Their values are 6.0 and 6.6 µg/ml, respectively. (The distance between the limiting values and the given Amount value must not necessarily be symmetrical.)