Displaying Calibration Curves
![]() Indicating the Confidence Interval
Indicating the Confidence Interval
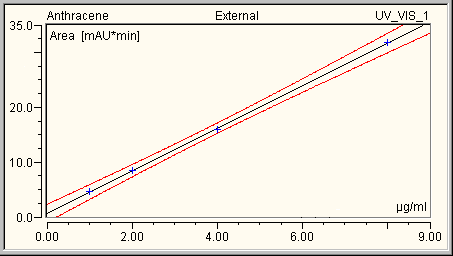
The confidence interval describes the range in which the "true" calibration curve will be found with a given probability. The range of the Confidence Interval grows linearly with growing standard deviation. The easiest way is to indicate the confidence interval graphically.
How To
Open the Calibration Plot Decoration dialog box by selecting Decoration on the context menu.
Select Draw upper & lower confidence limits on the Options tab page.
Select the probability with which the values should be within the confidence interval. The following options are available: 90%, 95%, 98%, 99%, 99.8%, 99.9%, and 99.99%.
The following example shows the confidence interval of a calibration at a probability of 99%:

You can indicate the limits of the confidence interval in the Report using the Upper and/or Lower Confidence Limit variables of the Peak Calibration peak category.
For more information, refer to How to …: Creating and Using Report Tables ![]() Setting Parameters for Variables (e.g., for the confidence interval).
Setting Parameters for Variables (e.g., for the confidence interval).