Displaying and Using UV Spectra
![]() Processing UV Spectra
Processing UV Spectra
For a better comparability of UV spectra, it is useful to subtract the background spectrum (of the solvent). Chromeleon performs this automatically, using the following algorithm:
The background spectra are determined for both peak ends. At both peak ends, several UV spectra can be averaged over a specified range.
The background peak spectrum (usually at the peak maximum) is determined via linear interpolation of these two background spectra and subtracted from the single spectrum (usually of the peak maximum).
![]() Tip:
Tip:
In addition, it is possible to combine several spectra to the Apex spectrum, and then subtract the background spectrum from this averaged spectrum. However, this is usually not necessary for UV spectra as they have a relatively low noise level compared to Mass Spectra.
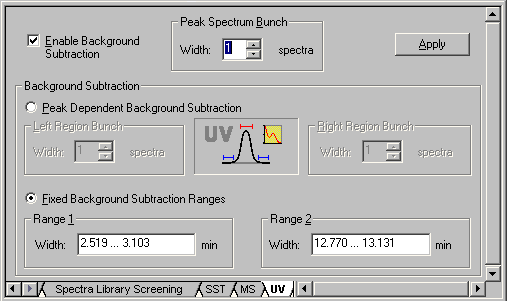
Use the UV tab of the QNT Editor to determine background subtraction for UV spectra. (For more information about the editor, see (see Data Representation and Reprocessing ![]() The QNT Editor.) The Enable Background Subtraction check box is enabled indicating that spectrum subtraction is active:
The QNT Editor.) The Enable Background Subtraction check box is enabled indicating that spectrum subtraction is active:

Only for UV spectra with a high noise level, it is necessary to average spectra to reduce the noise level. For example, spectra averaging may be required for very small peaks that are only slightly above the Limit of Detection. In the combo box under Peak Spectrum Bunch, enter the number of single spectra to be bunched to form the spectrum at the peak maximum. A maximum of 99 single spectra can be averaged. For symmetry reasons, it is possible to enter odd numbers only. Therefore, by default, only one spectrum is selected as Width of the Peak Spectrum Bunch.
Peak Dependent Background Subtraction allows automatic background subtraction for each peak. In the edit fields under Left Region Bunch and Right Region Bunch, enter the number of spectra to be used for forming the two background spectra. You can select up to 99 single spectra. Zero and even numbers are permitted as well. These settings apply to peak spectra and time spectra below peaks. The default setting is that one spectrum each is subtracted on both sides of the peak.
Select Fixed Background Subtraction Ranges to define two fixed ranges for background subtraction for the entire chromatogram. It usually makes sense to set one range at the beginning and the other one at the end of the chromatogram. These settings apply to peak spectra and to all time spectra.
Click Apply to accept the settings and calculate the resulting UV spectrum. When the Show Spectra view is enabled, the newly calculated UV spectrum is displayed at once.
![]() Note:
Note:
Defining the background subtraction manually in the chromatogram affects the settings on the UV tab page. For example, if you select UV Background Subtraction on the context menu of the chromatogram, and then select Fixed Background Ranges, the corresponding option is automatically selected on the UV tab page of the QNT Editor.