Defining Detection Parameters Graphically
Chromeleon supports entering detection parameters graphically: This considerably facilitates defining the time for the Detection Parameters.
How To
-
If no parameter is displayed in the chromatogram, use the Detection Parameter Tool. Either select this command on the context menu or click the following icon on the integration Toolbar:  .
.
-
In the chromatogram, move to the exact location where you want to enter a parameter.
-
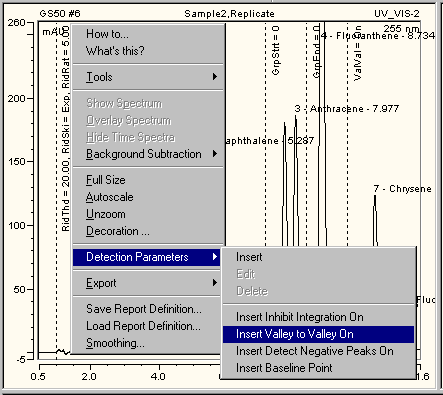
Select Detection Parameters on the context menu.
You can then select
-
-
Insert Inhibit Integration On or Off to inhibit or allow integration (see Integrating Chromatograms and Identifying Peaks  Inhibiting Peak Integration).
-
Select Insert to insert a new parameter.
-
The Detection Parameter Tools moves the entered parameters to the desired location in the chromatogram.
The example below corresponds to the table input in Integrating Chromatograms and Identifying Peaks  Defining Detection Parameters.

A dotted line indicates the parameters in the chromatogram. The short form for the parameters and their values are displayed along the line. The picture shows, for example, the Rider Threshold (in short: RidThd), Rider Skimming (RidSki), and Maximum Rider Ratio (RidRat) parameter values at 1.000 min.
To enter the detection parameters or other settings that influence peak calculation graphically, you also select a chromatogram area while holding the right mouse key. The context menu opens automatically. The menu contains the following commands:
-
Set Averaged Baseline Start and Set Averaged Baseline End to set an averaged baseline (see Working with Chromatograms  Defining an Averaged Baseline).
-
Set Minimum Area to define the minimum peak area.
-
Set Minimum Height to define the minimum peak height.
-
Set Minimum Width to define the minimum peak width (for more information about the Set Minimum commands, refer to Integrating Chromatograms and Identifying Peaks  Reducing the Number of Evaluated Peaks).
-
Set Peak Slice & Sensitivity to define the peak recognition algorithm (see Integrating Chromatograms and Identifying Peaks  Modifying the Peak Recognition Algorithm).
-
Set Inhibit Integration Range to select a range for the peak inhibition.
-
Set Void Volume Treatment Range to determine the range for recognition of the negative water peak. This overwrites all previous ranges for recognition of the negative water peak.
 Note:
Note:
You can undo the graphical input of detection parameters. Click one of the QNT Editor tables, and then select Undo on the Edit menu. (In the chromatogram itself, you can only undo the modifications made for the active chromatogram.)
When new detection parameters are entered graphically, they are automatically copied to the Detection tab page of the QNT Editor. (For more information about the editor, see Data Representation and Reprocessing  The QNT Editor.) They will be used for all samples that are evaluated with the QNT File of the current sample. As an alternative, you can also enter the detection parameters directly on the Detection sheet. (For more information, refer to Integrating Chromatograms and Identifying Peaks
  Defining Detection Parameters).
![]() .
.