Handling Files, Datasources, and the Network
![]() Analyzing the Datasource PQ Results
Analyzing the Datasource PQ Results
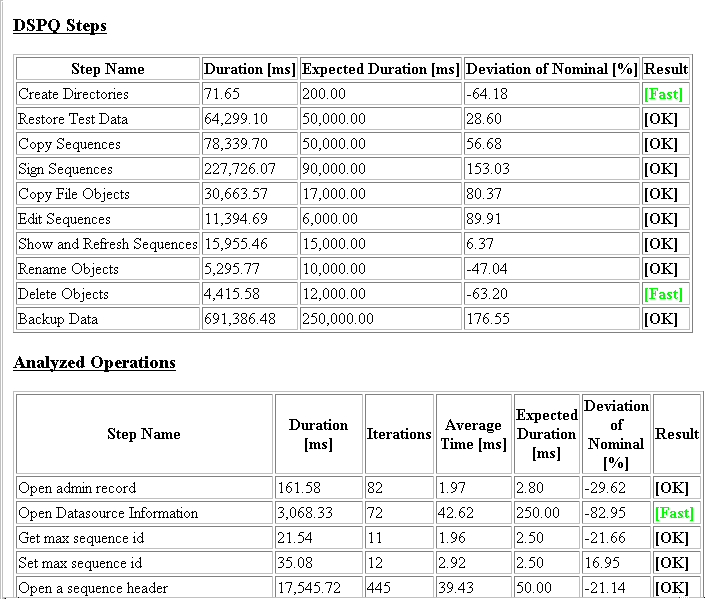
After datasource Performance Qualification is complete, Chromeleon automatically opens the specified report type:

In the report, the following information appears above the table (not shown in the above picture):
Datasource (for which PQ was performed)
Database Type (type of the associated database)
Template (used for datasource PQ)
Computer
Operator (who performed datasource PQ)
Start Time
End Time
DSPQ Log File
Report File
The DSPQ Steps section lists the single steps of datasource PQ (see ![]() Checking the Datasource Performance). The table compares the Duration (in [ms]) and the Expected Duration. The Deviation column shows the deviation of the measured duration from the expected duration. The value is in percent. The Result column shows the speed:
Checking the Datasource Performance). The table compares the Duration (in [ms]) and the Expected Duration. The Deviation column shows the deviation of the measured duration from the expected duration. The value is in percent. The Result column shows the speed:
|
Result |
Deviation [%] |
|
Fast |
< - 50 |
|
Ok |
-50 to 200 |
|
Slow |
200 to 900 |
|
Very Slow |
>900 |
![]() Tip:
Tip:
Only the result Very Slow indicates a problem.
The Analyzed Operation section lists details on the single operations. The Duration column shows the total time for the operation, including all repetitions. Contrary to the DSPQ Steps section, this table also includes the Iterations and Average Time. This table compares the average time with the expected time. The entries in the Results column are the same as for the Results column in the DSPQ Step table.
![]() Tip:
Tip:
Datasource PQ results may be different to a certain extent for each run.