Creating and Using Spectra Libraries
![]() Using Spectra Libraries
Using Spectra Libraries
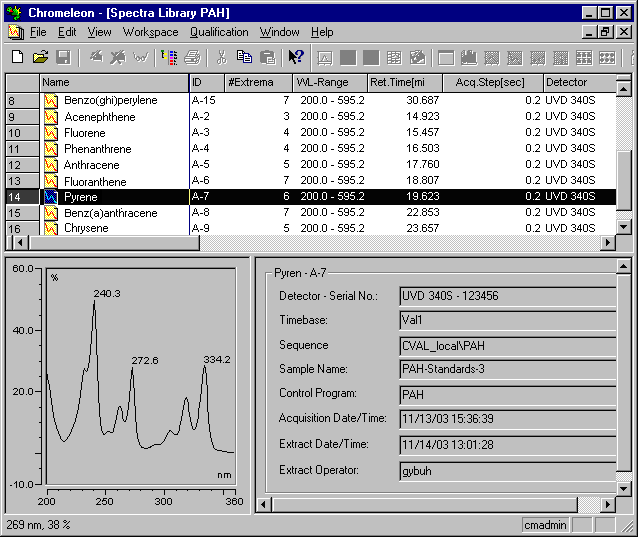
Spectra Table
The upper section lists all spectra that are contained in the active Spectra Library, as well as their data. Double-click a column header to sort the list according to the criteria of the selected column, such as the name, ID, or number of extremes. Select the first column of the table to select the corresponding spectrum.

When you move the mouse pointer into the left column, the cursor becomes a horizontal arrow. Left-click to select a spectrum.
To select several spectra, press and hold the CTRL key.
Spectra Plot
The spectra plot is displayed at the bottom left, underneath the table, showing the spectra of all substances selected in the spectra table.
Double-click the window or select Decoration on the context menu to change the spectra representation. For more information, refer to Integration ![]() The Spectra Plot.
The Spectra Plot.
Working with the Spectra Library
The objective of spectra administration is the identification of an unknown substance based on its UV spectrum. If you have a spectrum of a previously unidentified substance, for example, in the spectra window of the PPA method, you can start searching various libraries from there.
Chromeleon compares the curve form of the two spectra (comparison), calculates a similarity value (evaluation), and displays similar spectra (hit criterion).
The distinction made by Chromeleon depends on whether a single spectrum is identified or all peaks of a sample.
Hit List
The hit list lists all library spectra that have a certain similarity to the extracted (and normalized) spectrum. For more information, refer to Displaying and Using UV Spectra ![]() Searching Single Reference Spectra.
Searching Single Reference Spectra.
Peak Tracking
Assigning each peak in a chromatogram the spectrum of a library that matches the spectrum extracted at the peak maximum best is referred to as peak tracking.