Searching Reference Spectra
![]() Inserting Screening Results in Reports and Peak Labels
Inserting Screening Results in Reports and Peak Labels
If you save the search parameters in the QNT File, the results of the Spectra Library Screening can be used for the peak label or in report tables or templates (Printer Layout).
Inserting Screening Results in Report Definition Files
To display the screening results in the report, the Peak Purity report category supports the following variables:
Number of SLS Hits calculates the number of library screening hits for a peak.
SLS Hit opens the Hit Spectrum report category that includes all variables of the corresponding library spectrum:
|
Designation |
Description |
|
Substance Name |
|
|
Match Factor |
|
|
Library Name |
Name of the spectra library |
|
Library Record |
Opens the Spectra Library category |
|
Number of rel. Extrema |
|
|
Solvents |
|
|
Comment |
|
|
Sequence Name |
|
|
Sequence Header Record |
|
|
Sample Name |
|
|
Sample Record |
Branches to the Sample category |
|
Acquisition Time |
Acquisition date and time |
|
Timebase |
|
|
Program |
|
|
Sample Rate |
|
|
Retention Time |
|
|
Lambda Min. |
Minimum wavelength |
|
Lambda Max. |
Maximum wavelength |
|
Lambda Range |
Wavelength range |
|
Lambda Resolution |
Spectral wavelength resolution |
|
Detector Name |
|
|
Detector Serial Nr. |
|
|
Extract Time |
Time when the sample was added to the library |
|
Extract Operator |
User who added the sample to the library |
|
Retention Index |
Linear Retention Index |
|
Kovats Index |
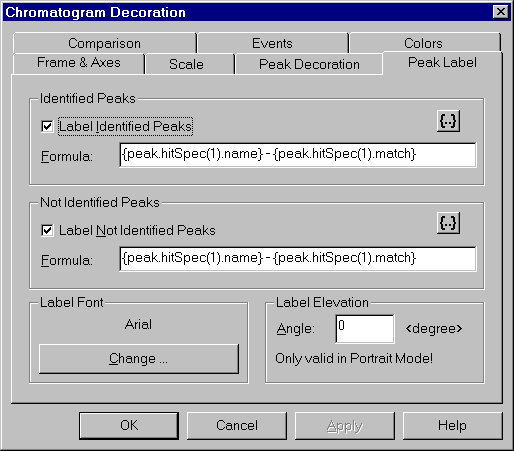
The Formula field shows a short version of your selection; for example, peak.hitSpec(1).name for the spectra name of the best hit. The digit indicates the hit: 1 is the best, 2 is the second best hit, etc.
Including Screening Results in the Peak Label
To include the screening results in the chromatogram, follow the steps below:
Position the cursor in the chromatogram.
Select Chromatogram Decoration on the context menu.
On the Peak Label tab page of the Chromatogram Decoration dialog box, click {...} to open the Insert Variable into Peak Label Formula dialog box. Select the Number of SLS Hits and SLS Hit variables (see Inserting Screening Results in Report Definition Files above) from the Peak Purity category.
Example
To label each peak in the chromatogram with the name of the best hit and the corresponding match factor, follow the steps below:
From the category Peak Purity, select the Substance Name under SLS Hit.
In the Formula field, enter " - " after the formula, then click Match Factor under SLS Hit.
Click OK. You receive the following Formula input on the Peak Label tab page of the Chromatogram Decoration dialog box:

![]() Tip:
Tip:
If you have saved the search parameters in the QNT File, it is sufficient to enable Spectra library screening results; for example, on the spectra plot. Just open the context menu and select the option via Spectra Decoration and Peak Spectra. In this case, you do not need to open the Spectra Library Screening dialog box and click Apply.