Analyzing 3D Amperometry Data
![]() Viewing I-t Plots in the 3D Amperometry Window
Viewing I-t Plots in the 3D Amperometry Window
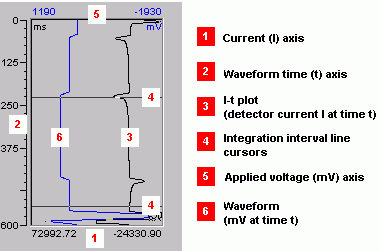
The lower left pane of the 3D amperometry window displays a plot of current (I) vs. waveform time (t). To better visualize this plot, imagine that a vertical slice of the 3D data is taken at retention time (T) and the slice is then laid flat. The left axis is the waveform period (ms) and the bottom axis is the current (nA). When the Waveform is displayed, the top axis on the plot indicates the applied voltage (mV).

![]() Tip:
Tip:
If the I-t plot pane is not displayed, enable the Show I-t Plot option on the context menu or click the following icon on the Method toolbar ![]() .
.
To display a different I-t plot:
On the 3D or chromatogram plot, drag the vertical retention time line cursor to a new position.
To show or hide the waveform display:
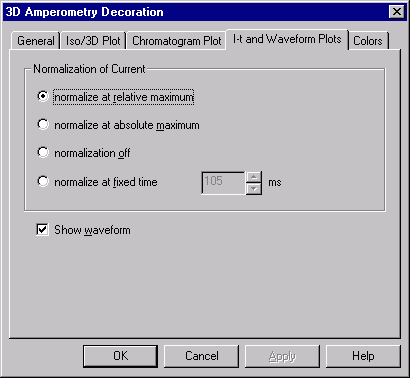
Double-click the 3D or I-t plot or select Decoration on the context menu.
Select the I-t and Waveform Plots tab.
Select the Show waveform check box to display the waveform or clear the check box to hide the waveform display.

Also, refer to: