Analyzing 3D Amperometry Data
![]() Selecting the Integrated or Raw 3D Amperometry View
Selecting the Integrated or Raw 3D Amperometry View
The 3D Amperometry Window has two options for viewing chromatographic 3D_Amp data:
Integrated data view
Raw data view
To distinguish between the two views:
In integrated data view, parallel integration interval line cursors appear on the 3D data and I-t plots. The Y-axis units on the chromatogram displayed above the 3D data plot are nC (nanoCoulombs).
In Raw data view, a single horizontal line cursor for selecting waveform time is displayed instead of the integration cursors. The Y-axis units on the chromatogram displayed above the 3D data plot are nA (nanoAmps).
To select the view option:
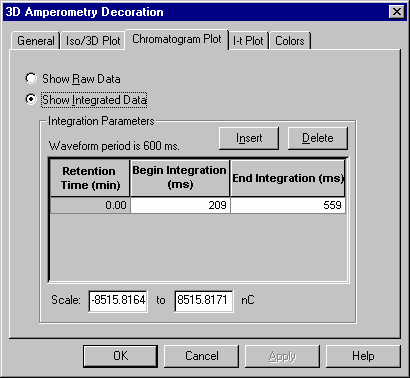
Double-click the 3D or I-t plot or select Decoration on the context menu.
On the Chromatogram Plot tab page, select either the Show Raw Data option or the Show Integrated Data option.

Also, refer to: