Analyzing 3D Amperometry Data
![]() Changing the 3D Amperometry Plot Scale
Changing the 3D Amperometry Plot Scale
When you initially open a sample's 3D amperometry data, the window displays the data in full-scale view (i.e., the axes on each plot include the full range of data values from the analysis). There are several methods for adjusting the scale of a plot to zoom in or out to show the data of interest:
![]() Tip:
Tip:
Changing the scale on one of the plots (chromatogram, raw 3D data, or I-t) also changes the scale of the other plots.
Point to an area on a plot and then drag to define the area to zoom into.
Select commands from the View or context menu (right-click to open the context menu):
|
|
|
|
Full Size |
Adjusts the scale of all plot axes to include the entire 3D data set. |
|
|
|
|
Autoscale |
Adjusts the signal axis optimally for the selected data. |
|
|
|
|
Zoom to Integration Interval |
Adjusts the waveform period axis (ms) on the 3D and I-t plots to display only the integrated portion of the data. The response axis (nC) on the chromatogram and 3D plots is adjusted to the range of responses in the integrated data. |
|
|
|
|
Unzoom |
Reverses the previous zoom steps one by one. |
|
|
|
Adjust scaling parameters manually using the Decoration dialog box:
Double-click the plot or select Decoration on the context menu to open the dialog box.
Then, go to the General and/or Chromatogram Plot tab pages to adjust scaling parameters:
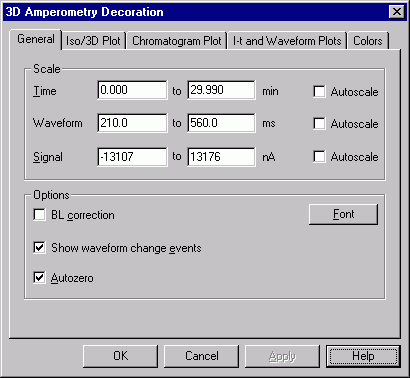
On the General tab page, clear the Autoscale check boxes and then enter the values for the Time, Waveform, and Signal axes.
![]() Tip:
Tip:
When the Autoscale check boxes are enabled, the plot axes are adjusted to include the full range of data values from the analysis. Clearing the check boxes lets you enter specific values for each axis.
On the Chromatogram Plot tab page, enter the Scale values for the response axis.
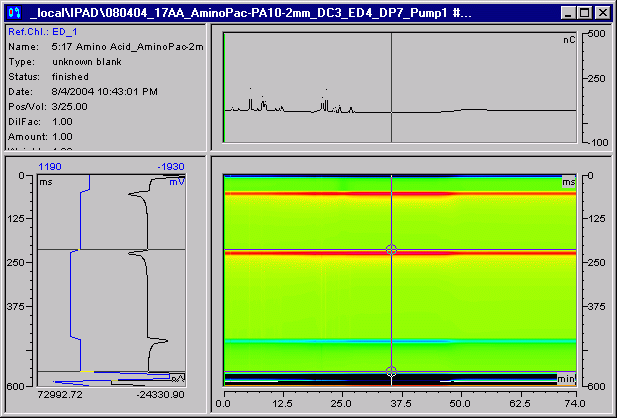
In the following examples, the first window shows 3D data in the initial full size scale.

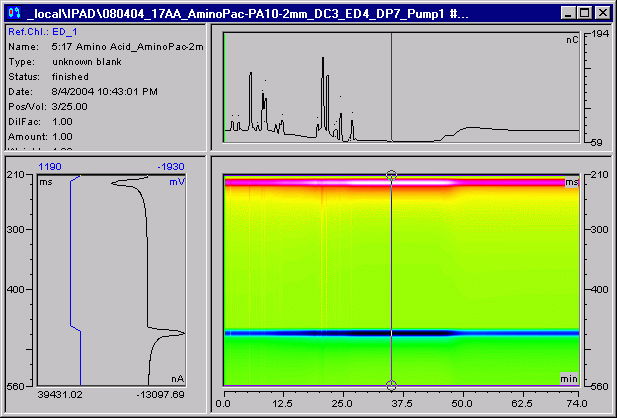
After selecting Zoom to Integration Interval, the window looks like this:

The Scale parameters on the General tab page of the Decoration dialog box can be used to adjust the scale further:

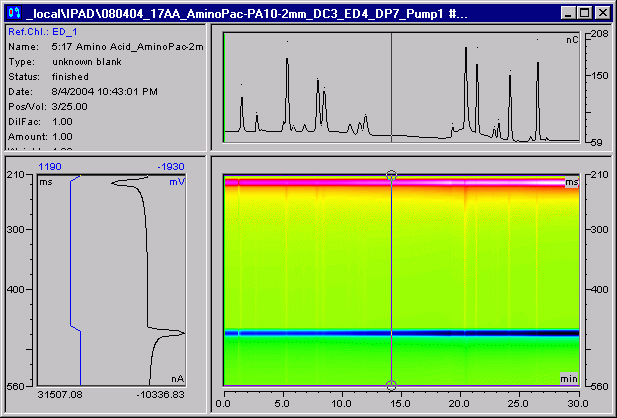
Time: Adjusted to include only the peaks of interest (no peaks of interest occurred after about 30 minutes).
Waveform: Adjusted to the length of the integration interval (done by the Zoom to Integration Interval command).
Signal: Adjusted to the highest response within the integration interval (done by the Zoom to Integration Interval command).
These settings result in the following plot display:

Also, refer to: