Using Mass Spectrometers
![]() Processing Mass Spectra
Processing Mass Spectra
Mass Traces have a relatively high noise level. Therefore, they must be processed before being used further. Chromeleon uses the following algorithm:
First, the spectrum of the peak maximum is determined by averaging several spectra in the peak maximum on both ends.
Then, the background spectra of both peak ends are determined, also by averaging several spectra.
The background peak spectrum (usually at the peak maximum) is then determined via linear interpolation of these two background spectra and subtracted from the single spectrum (usually of the peak maximum).
![]() Tip:
Tip:
Only mass spectra recorded with the same filter settings are averaged and subtracted. The filter settings of the Apex mass spectrum of the current peak are used for this. For time spectra, the filter settings of the mass spectrum nearest to the selected retention time are used.
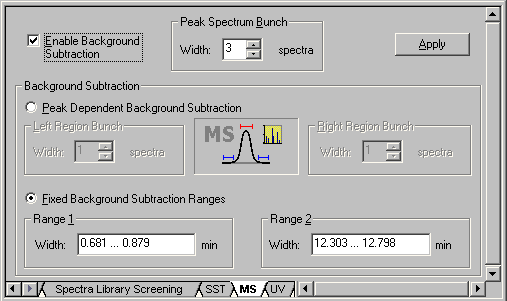
In the QNT Editor, use the MS tab page to specify how mass spectra are formed from individual spectra. (For more information about the editor, see Data Representation and Reprocessing ![]() The QNT Editor.) Select the Enable Background Subtraction check box to enable spectrum subtraction:
The QNT Editor.) Select the Enable Background Subtraction check box to enable spectrum subtraction:

In the combo box under Peak Spectrum Bunch, enter the number of single spectra to be bunched to form the spectrum at the peak maximum. A maximum of 99 single spectra can be averaged. For symmetry reasons, it is possible to enter odd numbers only.
Select Peak Dependent Background Subtraction to allow automatic background subtraction for each peak.
In the edit fields under Left Region Bunch and Right Region Bunch, enter the number of spectra to be used to form the two background spectra. You can select up to 99 single spectra. Zero and even numbers are permitted as well. These settings apply to peak spectra and time spectra below peaks.
Select Fixed Background Subtraction Ranges to define two fixed ranges for background subtraction for the entire chromatogram. It usually makes sense to set one range at the beginning of the chromatogram and another range at the end. These settings apply to peak spectra and to all time spectra.
Click Apply to accept the settings and calculate the resulting mass spectrum. When the Show Spectra view is enabled, the newly calculated mass spectrum is displayed immediately.
![]() Note:
Note:
Defining the background subtraction manually in the chromatogram affects the settings on the MS tab page. For example, if you select MS Background Subtraction on the context menu of the chromatogram, and then select Fixed Background Ranges, the corresponding option is automatically selected on the MS tab page of the QNT Editor.