The 3D Amperometry Window
![]() Data Selection
Data Selection
The 3D Amperometry window provides the following data selection features:
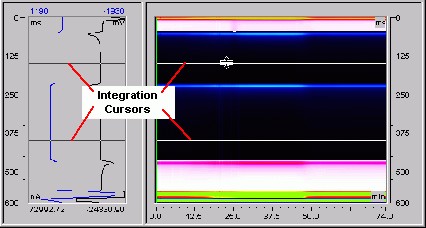
If integration is enabled, parallel horizontal line cursors on the 3D and I-t plots select the Integration Interval. You can move the integration interval by dragging the top line on either the 3D or I-t plot. You can also increase or decrease the width of the interval by dragging the bottom line. Changing the integration interval selects new data to be integrated. This generates a new chromatogram, which is displayed on the chromatogram plot.
![]() Tip:
Tip:
If multiple integration intervals are present, select the interval that you want to change by dragging the vertical retention time line cursor into the interval's time range.

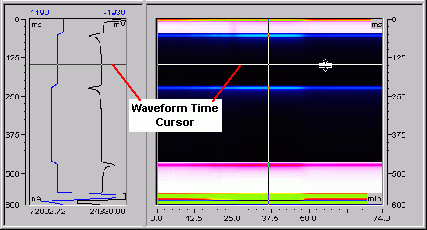
If integration is disabled, a single horizontal line cursor on the 3D and I-t plots selects a waveform time slice. The selected waveform time determines which data points are used to plot the chromatogram. You can drag the cursor to select a different waveform time and generate a new chromatogram.

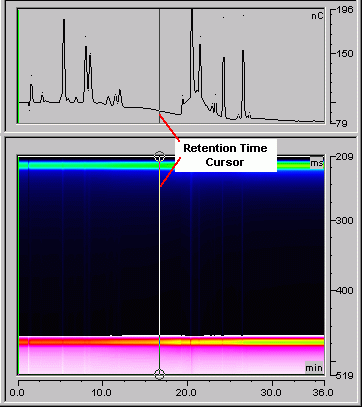
The vertical line cursor on the 3D and chromatogram plots selects a retention time slice. The selected retention time determines which data points are used to create the I-t plot. You can drag the cursor to select a different retention time and thus generate the corresponding I-t plot.

The mouse can be used to zoom into an area of a plot. Point and drag to draw a frame around the area that you want to zoom into.
The View and context menus also provide commands for selecting data.
![]() Tip:
Tip:
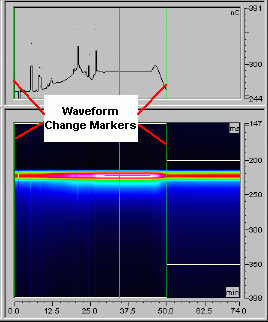
If multiple waveforms were applied during the run, or if additional integration intervals were added post-run, non-movable vertical markers (in green) designate where each waveform change occurs.

Also, refer to ![]() Analyzing 3D Amperometry Data.
Analyzing 3D Amperometry Data.