Chromeleon Xpress: Viewing Real-Time Data and Instrument Status
![]() The Status Panel
The Status Panel
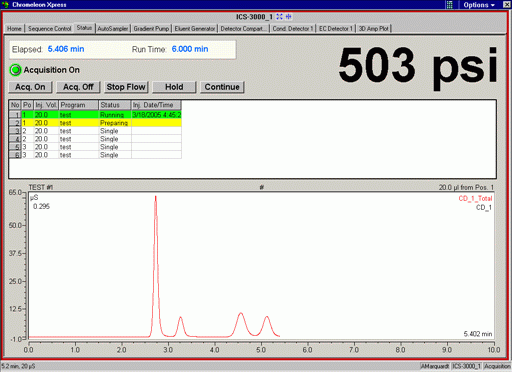
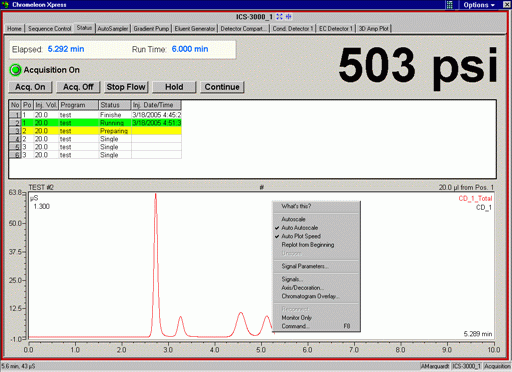
The Status panel provides a quick overview of the system status. It displays the status of the currently running sample and the current pump pressure. The data plot and pressure reading are enlarged to facilitate viewing from a distance.

Elapsed is the elapsed time since the start of data acquisition.
Run Time is duration (in minutes) of data acquisition for this injection.
Acquisition On/Off indicates whether data is being collected.
psi (or bar or MPa) displays the current pump pressure.
The buttons let you manually control the system: Acq On and Acq Off start and stop data acquisition, Stop Flow stops the pump flow, Hold pauses the sequence, and Continue restarts the sequence.
The table displays information about the samples in the currently running sequence.
The remainder of the panel displays a real-time plot of the current data. This can include detector signal data and/or pump pressure data. More than one Channel can be displayed simultaneously.
![]() Tip:
Tip:
To change the plot scale or select other plot options, point to the plot and right-click to open the context menu. For a description of the plot scaling commands, refer to ![]() Control Panel: The Signal Plot.
Control Panel: The Signal Plot.

Also, refer to ![]() Viewing Real-Time Data and Instrument Status.
Viewing Real-Time Data and Instrument Status.