Location:
Report Variable (Peak Calibration)
Type:
Floating point number
Dimension:
%
Value Range:
-1 - +1
Default:
Related Parameters:
Description:
The linear Correlation Coefficient indicates the "linear dependence" between two variables (for example, the peak area and the amount (concentration) of an analyte). It can range from –1 to +1 (-100% to +100%).
If all data points are located on a straight line, the correlation coefficient is exactly +1 or -1 (or ±100%). If the data points are scattered very much, the coefficient approximates 0.
Function:
Contrary to the Coefficient of Determination, the correlation coefficient only indicates the linear dependence between two variables. This means that, for example, with a quadratic calibration function, the correlation coefficient may be very low due to the curve shape, although all data points are located on or close to the calculated curve. In this case, the coefficient of determination will be near 1 or 100%, whereas the correlation coefficient will be near zero.
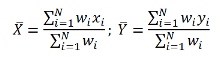
The mathematical description of the correlation coefficient is as follows:
With: |
N |
Number of standard samples involved in the calibration, |
|
i |
Index for standard samples, |
|
Wi |
Weight factor of the standard sample no. i |
|
Xi |
X-value of the standard sample no. i |
|
|
weighted average value of all x-values |
|
Yi |
Y-value of the standard sample no. i |
|
|
weighted average value of all y-values
|
![]() Tips:
Tips:
For a linear calibration plot that is not forced through the origin, the correlation coefficient corresponds to the square root of the coefficient of determination. In all other cases, this does not apply.
Use the coefficient of determination if you are using either non-linear calibration curves or a linear calibration curve forced through the origin.