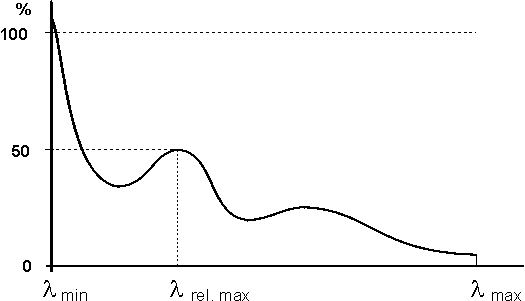
Normalization (Relative Maximum)
The relative maximum of the response is determined. This will be the greatest l-peak of the spectrum or the greatest current-peak of the I-t plot. After normalization, this peak has the height 0.5 (50%). This prevents normalization with incomplete maxima on spectrum or I-t plot margins.
![]() Tip:
Tip:
Note that response maxima can exceed the 100% line on the margin of the plot, due to the definition!
Also, refer to Normalization (Overview)