Comparing Chromatograms
![]() Displaying Several Chromatograms
Displaying Several Chromatograms
After adding an Overlay (= an additional chromatogram), you can define the display arrangement for the two chromatograms.
How To
Select Decoration on the context menu of the chromatogram plot.
In the Chromatogram Decoration dialog box, select the Comparison tab page and define the chromatogram Arrangement:
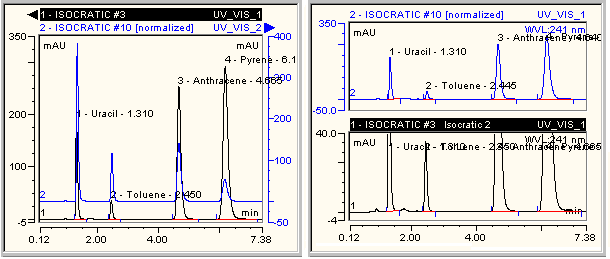
Select Overlay to overlay the single chromatograms on one single plot (see the left section of the screenshot below).
Select Stack to display the chromatograms one below the other in different plots (see the right section of the screenshot below).
Select Mixed to combine the Overlay and the Stack option. Chromatograms of different detectors are displayed as single plots.

Use the Overlay view to add an additional signal axis (on the right). The axis refers to the overlaid chromatogram that was added last using the Overlay with right signal axis command. This command, too, is available on the Comparison tab page of the Chromatogram Decoration dialog box. Thus, you can select a different signal range for the chromatogram that was added last. Use the Stack view for individual scaling of the signal axis for each single chromatogram.
To offset the chromatograms in x- and/or y-direction in the Overlay view, set the signal or time offset on the Comparison tab page.
Select the Time check box to move the active chromatogram in the x-direction.
Select the Signal check box to move the active chromatogram in the y-direction.
The offset is specified in percent of the signal or time axis. A signal offset of 5% shifts each of the following chromatograms upwards by 5%. Accordingly, a time offset causes a percentage alteration in the x-direction. This results in a "pseudo-3D" presentation.
Chromeleon supports several actions for overlaying chromatograms. For an overview, refer to ![]() Comparing Chromatograms.
Comparing Chromatograms.